Is understanding data spread crucial for making informed decisions? The concept of "range" provides a fundamental tool for grasping the distribution of values within a dataset, offering a quick yet insightful measure of variability.
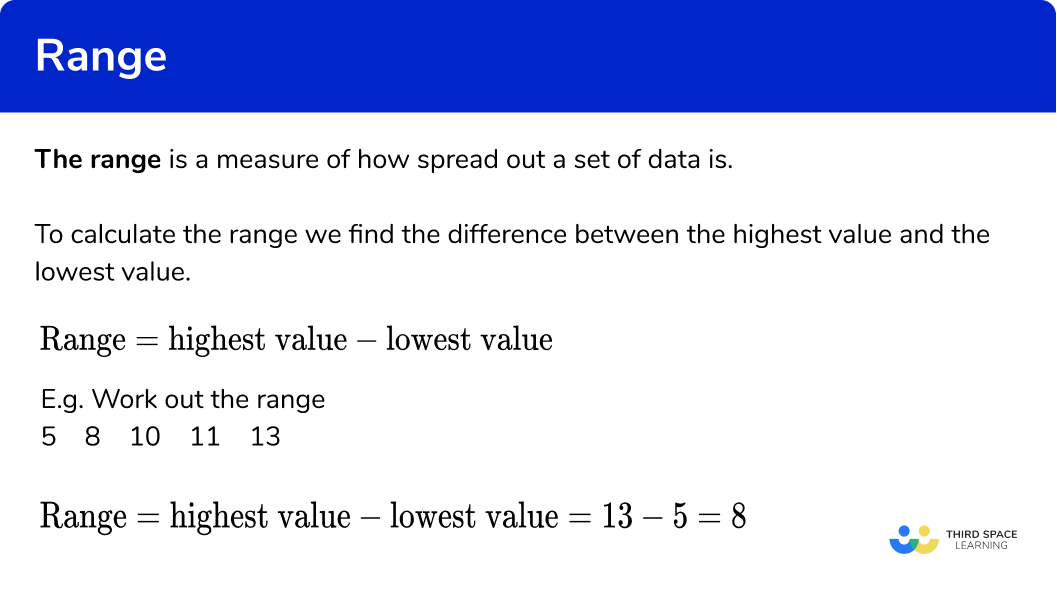
The term "range" in mathematics and statistics, at its core, refers to the difference between the highest and lowest values within a given dataset. This simple calculation provides a foundational understanding of the spread of data, indicating how far apart the extreme values are. Whether analyzing test scores, financial figures, or scientific measurements, the range offers a preliminary insight into the data's distribution.
Calculating the range is straightforward. Simply subtract the smallest value in the dataset from the largest. For instance, if a set of test scores includes 75, 80, 90, and 100, the range is 100 - 75 = 25. This indicates the scores span a 25-point interval. However, it's vital to remember that the range provides only a snapshot, potentially masking complexities within the data.
To delve deeper into the utility of the range and its relationship with other statistical measures, consider the following table, which elucidates the calculation, advantages, limitations, and applications of this fundamental concept.
| Aspect | Description | Details |
|---|---|---|
| Definition | The difference between the highest and lowest values in a dataset. | Simple subtraction: Maximum Value - Minimum Value. |
| Calculation | Identify the maximum and minimum values, then subtract. | For example, in the set {3, 5, 7, 4, 8, 9}, the range is 9 - 3 = 6. |
| Advantages | Easy to calculate and understand. Provides a quick overview of data spread. | Requires minimal computation. Useful for initial data exploration. |
| Limitations | Sensitive to outliers. Doesn't reflect the distribution of values between the extremes. | A single extreme value can significantly inflate the range, misrepresenting the typical spread. |
| Applications | Used in various fields to assess data spread, from finance to science. | Analyzing stock prices, exam scores, or experimental results. |
| Misleading Factors | Outliers drastically affect the range. | Consider {1, 2, 3, 4, 100}. The range is 99, but most values cluster around 1-4. |
| Comparisons | Compared with mean, median, mode, and other measures of spread like interquartile range (IQR). | Provides a more comprehensive understanding when used with central tendency measures. |
| Central Tendency | Used alongside measures of central tendency (mean, median, mode) to understand the complete data set. | Offers a clear picture of data distribution (span of the distribution). |
| School Introduction | Introduced to students in middle and high school. | Subjects like algebra, geometry, and statistics utilize range. |
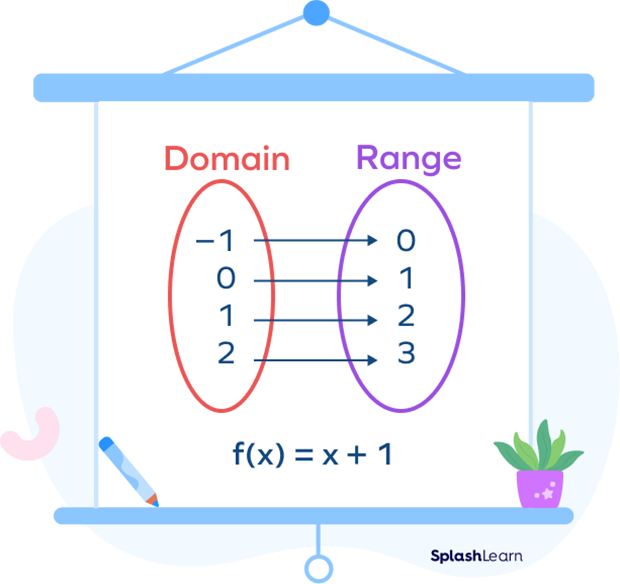
| Function Range | Can also refer to the set of output values of a function. | Domain and range are key concepts in relations and functions. |
| Real-Life Examples | Test scores, salaries, temperature ranges. | Helps make sense of data, for example, the variation in sales figures. |
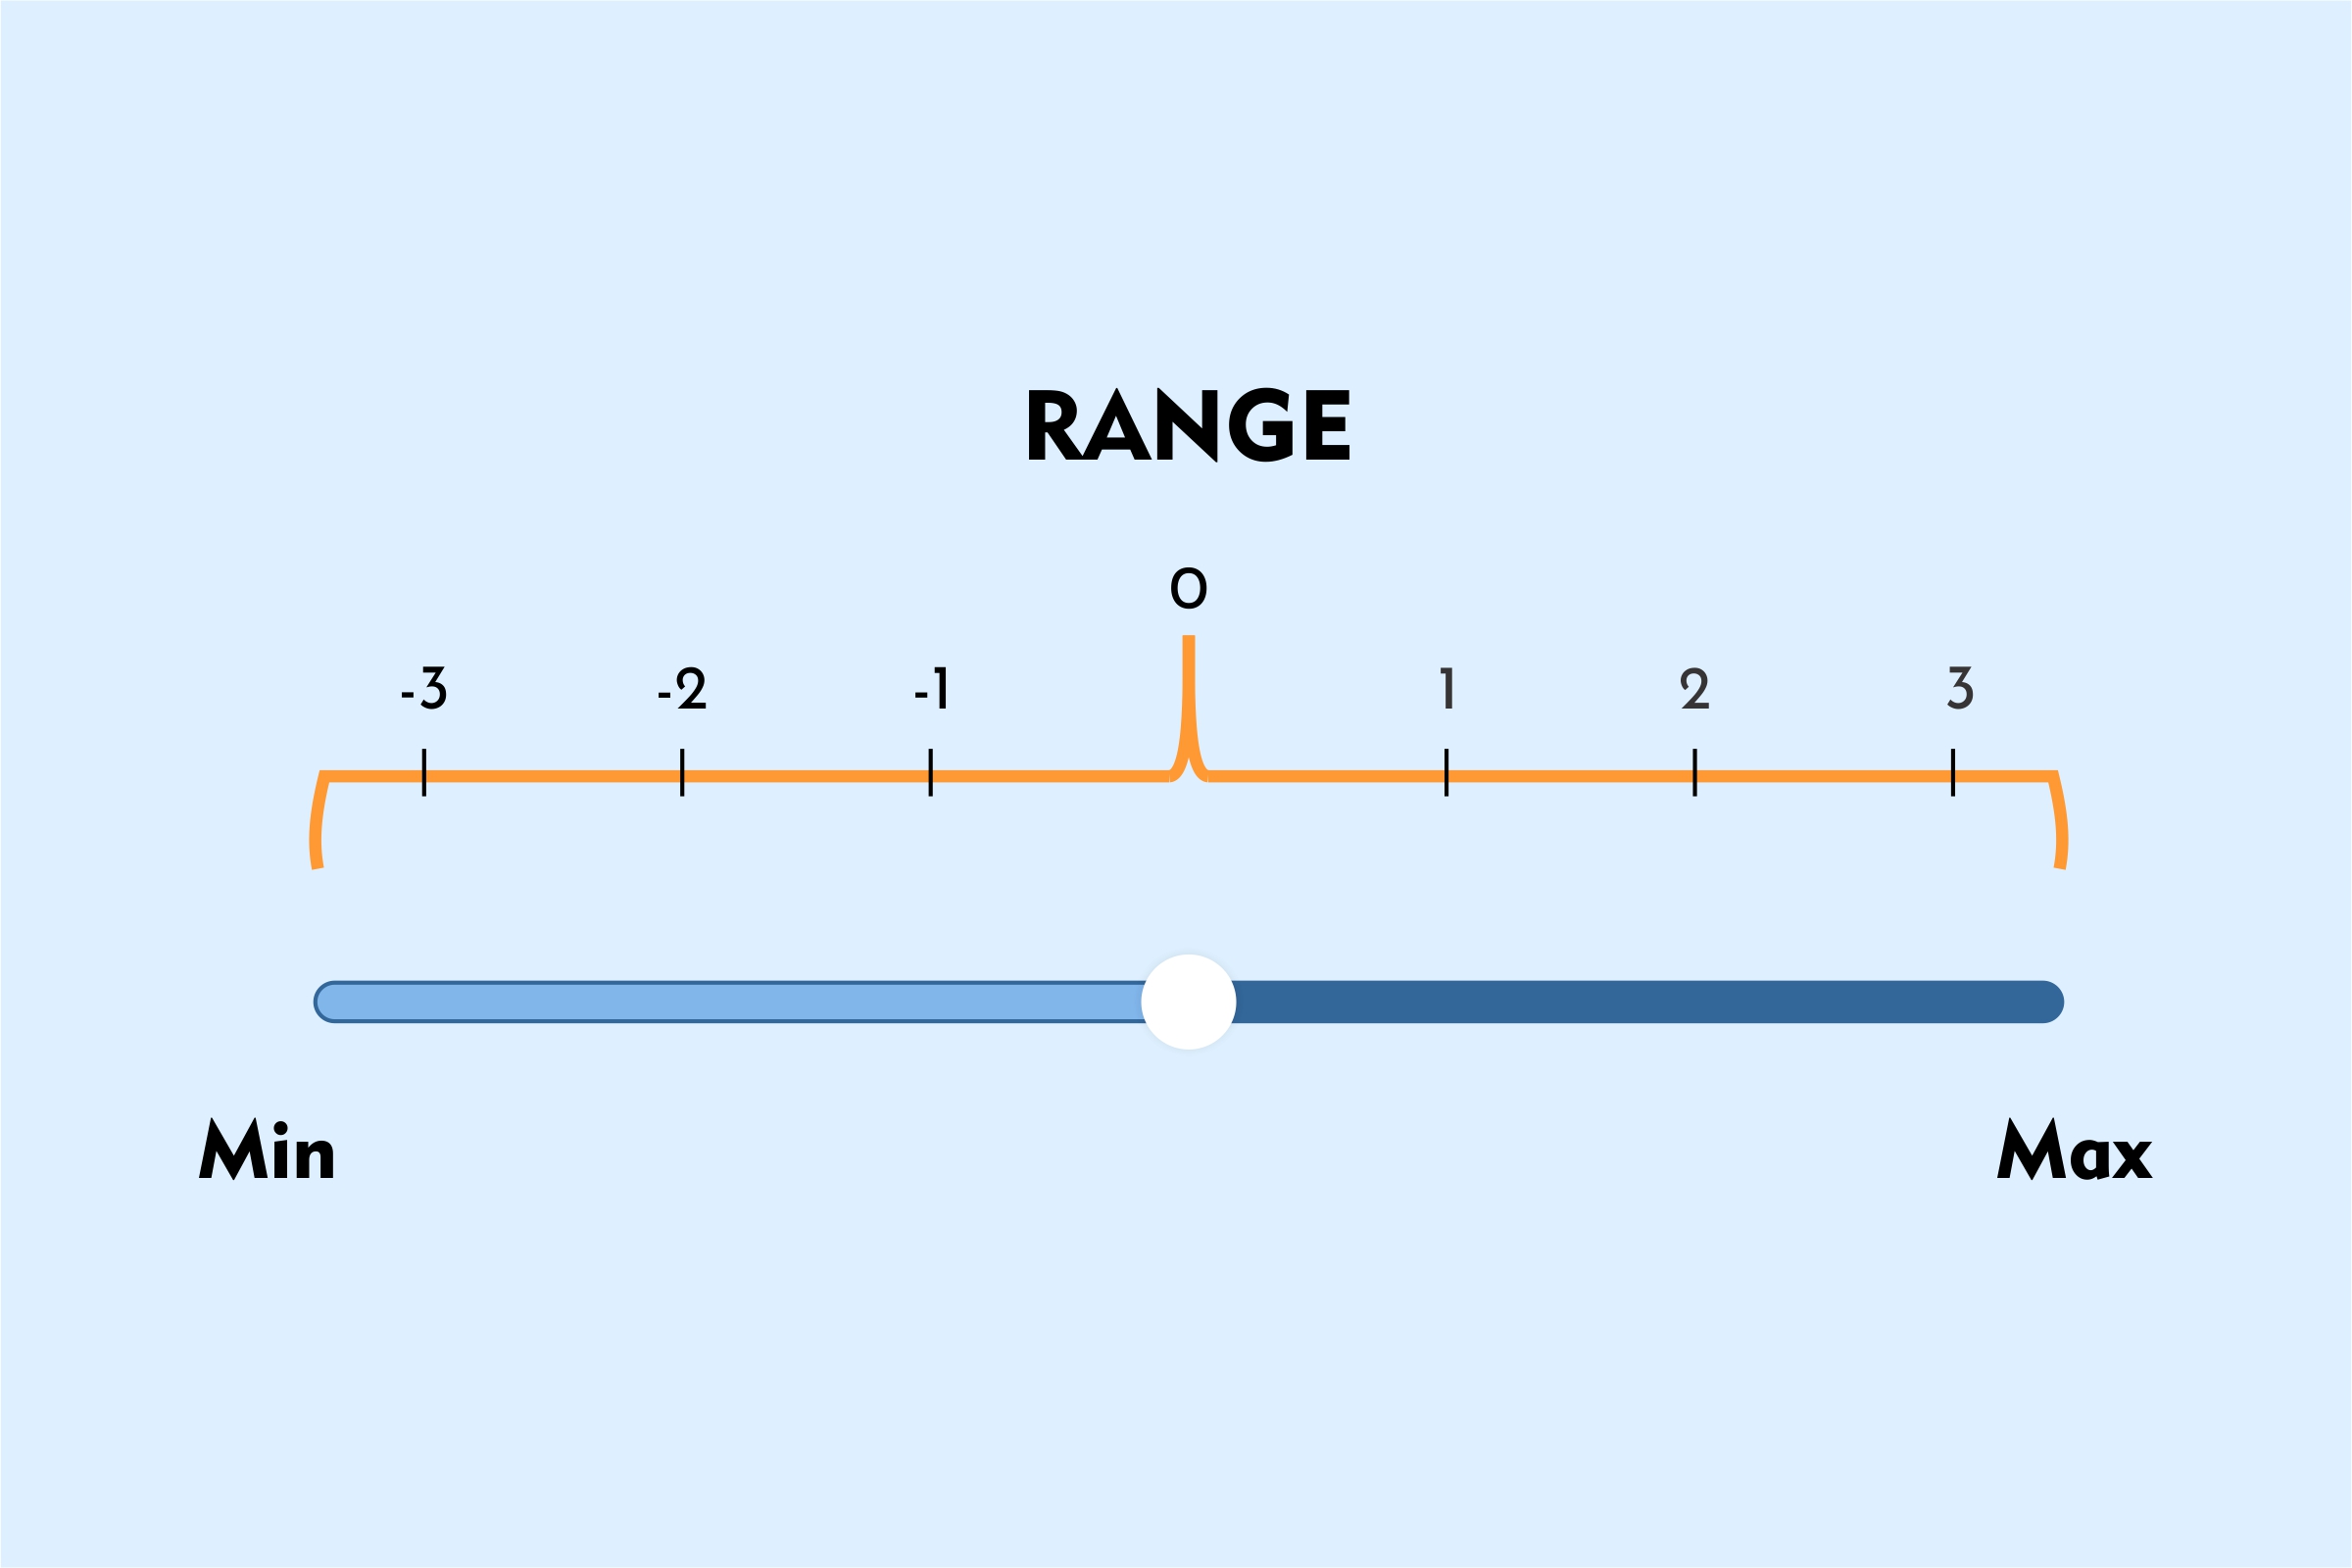
| Negative Numbers | The range can be calculated with negative numbers. | The calculation remains: maximum value - minimum value. |
| Data Ordering | Ordering data from least to greatest is helpful. | Especially important with large datasets. |
| Rough Estimate | Provides a quick estimate of the spread of data. | Offers an initial understanding of the variability. |
Reference: Investopedia - Range
- Jonathan Nowzaradan Bio Net Worth Family Career Uncovered
- Erome Lexi2legit Exclusive Pics Videos Await